Graph digitizer software
Graph digitizer software turns a picture of a graph back into numbers you can work with. With Zenith Data Extractor you load an image of the chart, trace the curve you need and export the data points, ready to use in a spreadsheet or to extract an equation from the graph.
| Q | H |
|---|---|
| 0.0 | 42.00 |
| 20.0 | 40.60 |
| 40.0 | 36.40 |
| 60.0 | 29.40 |
| 80.0 | 19.60 |
| 95.0 | 10.41 |
Good to know: Data Extractor gives you the data, not the formula. It traces the curve and exports accurate x and y values. From there you can fit an equation in Excel or whatever analysis tool you already use.
How to digitize a graph
Two steps: trace the graph image, then export the data and, if you need one, the equation.
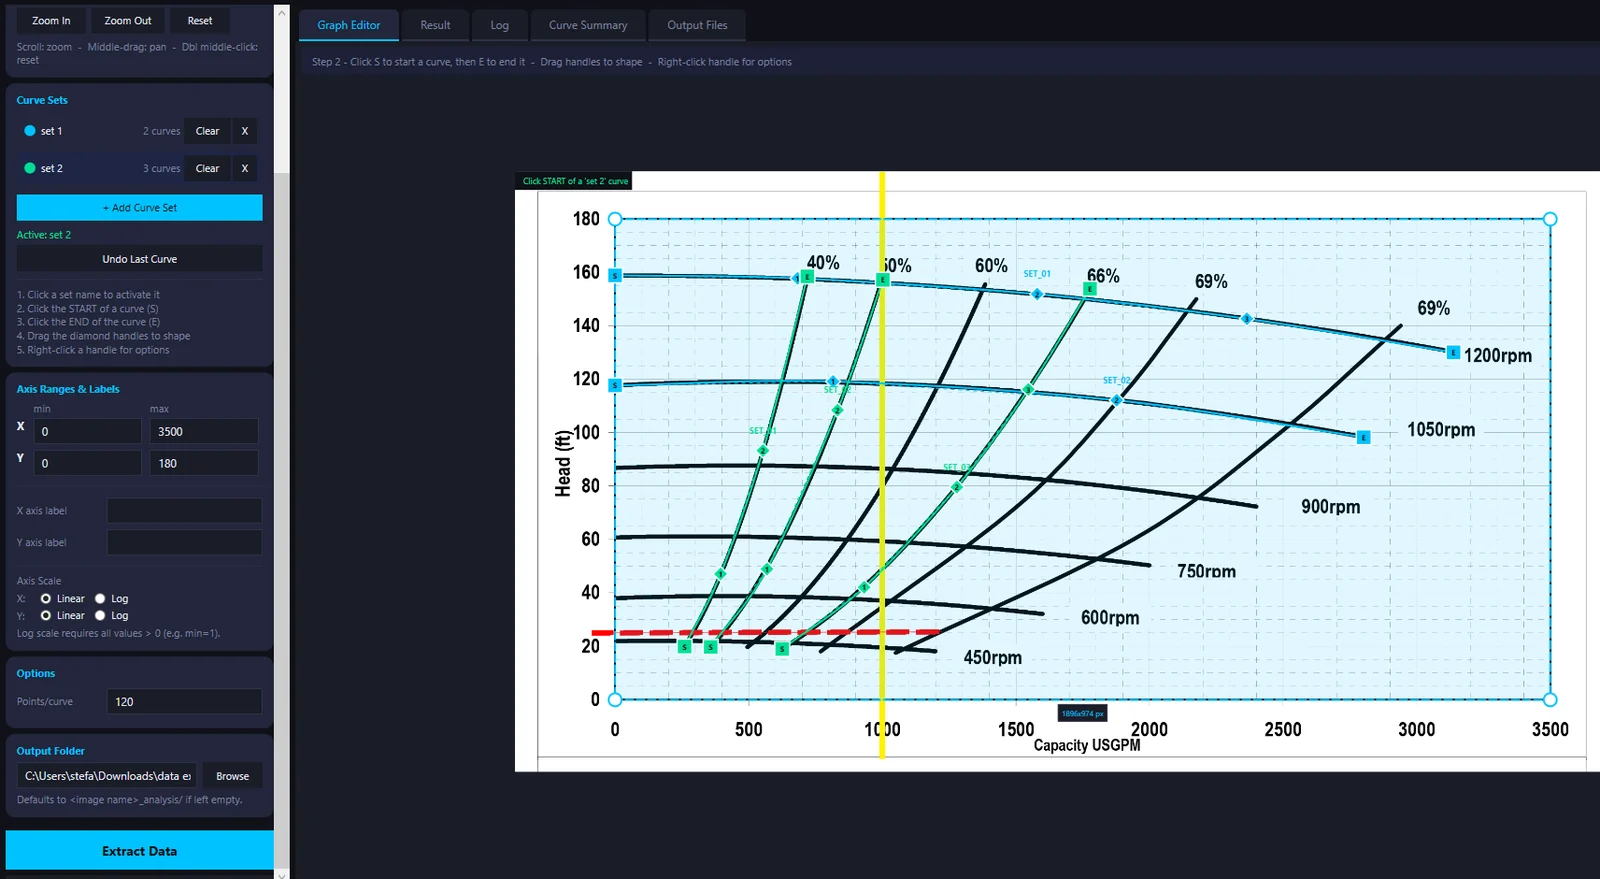
Step 1: Add image and trace the required graph
Open a screenshot, scan or photo of the graph in Data Extractor. You can digitize graphs from datasheets, catalogue curves, textbook figures and old reports.
Drag a box around the plot area and enter the axis ranges, so every point on the image maps to a real value. Each axis can be linear or logarithmic.
Trace each curve by clicking its start and end, then drag the handles until the spline sits on the line. Group related curves into sets, such as impeller diameters and efficiency lines.
Step 2: Export the data / get equation
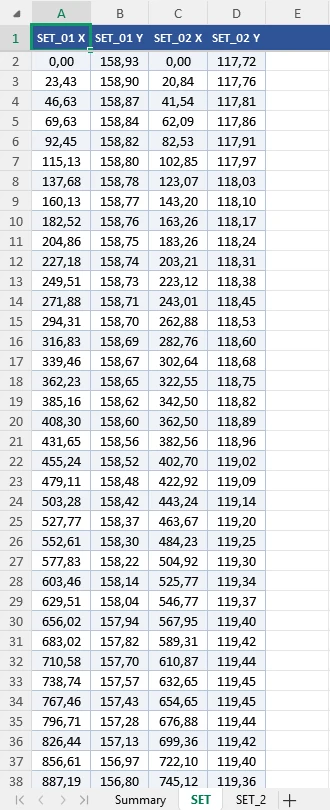
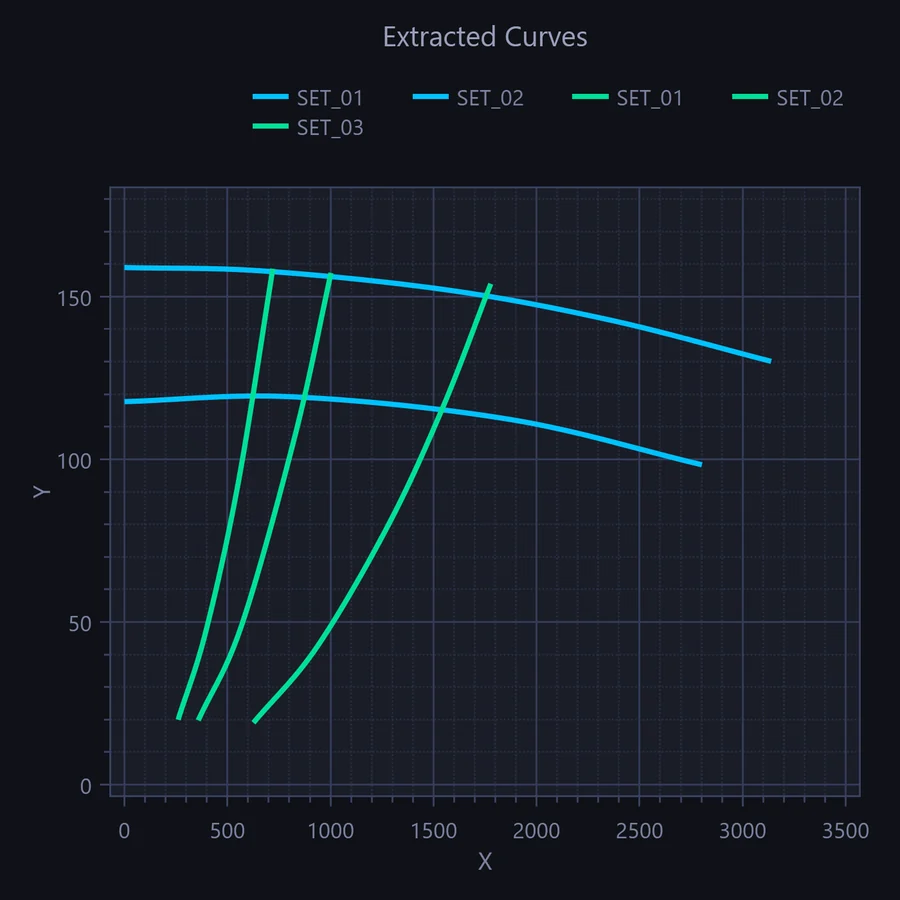
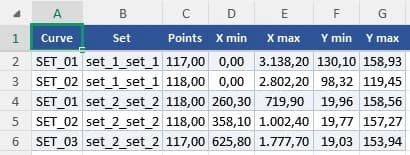
Click Extract Data. Each curve is sampled into the number of points you choose and saved to an Excel workbook in your output folder: a summary sheet, plus a sheet of X and Y columns for each curve set. A chart of the extracted curves is saved with it.
Need an equation? Load the exported points into Excel or your analysis tool and add a trendline or curve fit to the data.
Standard extraction workflow
This is how a graph digitizer works. The same five stages apply to almost any chart, from a pump datasheet to a figure in a research paper.
Load the graph image
Browse to a screenshot, scan or photo of the chart. Use the sharpest copy you can find: a clean image gives a more accurate trace.
Calibrate the axes
Select the plot area, then enter the minimum and maximum of each axis and its label. Set each axis to linear or logarithmic to match the chart.
Trace the curves
Click the start and end of a curve, then drag the handles to shape the spline along the line. Keep related curves together in curve sets, and mark an operating point if you need one.
Extract the data
Choose how many points to sample per curve and an output folder, then click Extract Data. The data is saved to an Excel workbook.
Check the result
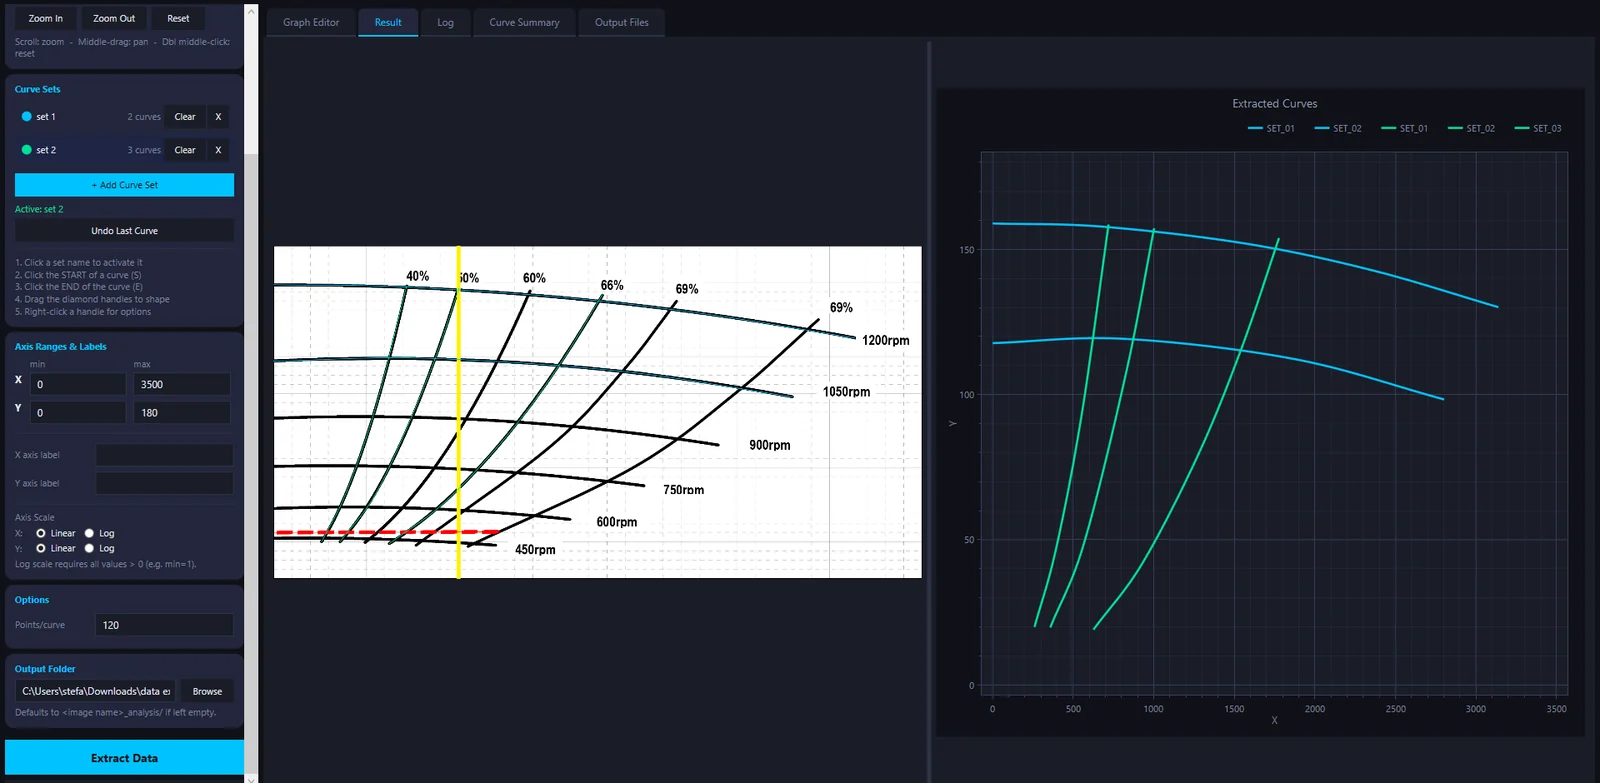
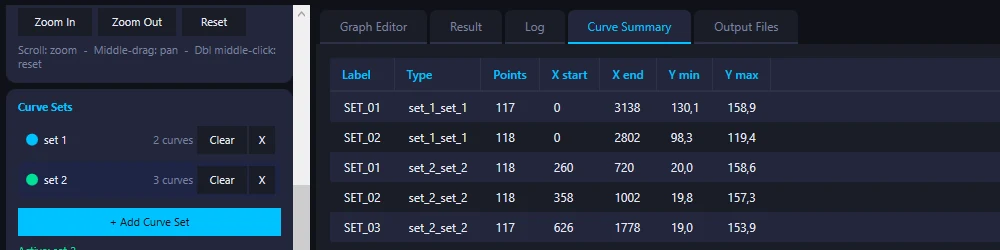
Compare the extracted curves side by side with the original image, and review each curve's range and point count in the curve summary.
Inside Zenith Data Extractor
A pump curve chart with several speeds and efficiency lines, traced and extracted.
Where engineers use a graph digitizer
Pump and fan curves
Turn head–flow, efficiency and power curves from a supplier datasheet into an equation for your sizing spreadsheet or simulation.
Material and property charts
Pull values from property charts and correlations in handbooks when only the graph is published.
Research papers
Recover data from published figures to compare against your own results or reuse in a model.
Old reports and scans
Get numbers back out of legacy test reports where the original data is long gone.
Frequently asked questions
What is a graph digitizer?
A graph digitizer (or graph digitiser) is software that turns an image of a graph back into numbers. You calibrate the axes, trace the curve, and it extracts the x and y values. It's used when a graph is published but the data behind it isn't, such as on datasheets and in research papers.
How do I extract data from a graph image?
Load the image into a graph digitizer like Zenith Data Extractor, select the plot area and enter the axis ranges, trace the curve and extract the points to Excel. This is much faster and more accurate than reading values off the graph by eye.
Can I export digitized graph data to Excel?
Yes. Zenith Data Extractor saves the extracted data as an Excel workbook: a summary sheet listing every curve, plus a sheet of X and Y columns for each curve set.
How can I determine a function equation from a graph?
First get the data off the graph: graph digitising software like Zenith Data Extractor traces the curve and exports its x and y values. Then fit an equation to that data in Excel or your analysis tool. Getting accurate data from the graph is the slow part, and it's the part Data Extractor does for you.
Does Zenith Data Extractor give me the equation automatically?
No. Data Extractor extracts the data points from the graph image. You then fit the equation to that data in Excel or your own analysis tool.
Can Excel find the equation of a graph?
Yes, if you have the data. Plot the points as a scatter chart, add a trendline, choose its type and tick Display Equation on Chart. If you only have a picture of the graph, digitise it first to get the data.
How accurate is data extracted from a graph image?
It depends mostly on the image. A sharp, high-resolution image with clearly marked axes gives the best results. Thick lines, blurry scans and skewed photos all reduce accuracy, so use the cleanest copy of the graph you can find.
Can I digitise a graph with logarithmic axes?
Yes. Data Extractor supports logarithmic axes, which are common on engineering datasheets and property charts.
Digitize your graphs
Zenith Data Extractor is a graph digitizer for Windows with a one-time licence. See screenshots, features and pricing on the product page.
View Zenith Data Extractor